
For the last few months, I have been studying Bank Nifty charts, FNO , market psychology, volume analysis, and option price behavior. Instead of risking large amounts of money, I decided to test a simple intraday strategy using just 1 lot of Bank Nifty options.
The objective was not to become rich overnight.
The objective was simple:
Can I consistently identify high-probability setups using technical analysis?
Recently, I found a setup that gave me confidence that I may finally be moving in the right direction.
This article is not financial advice. It is simply a record of my learning journey and observations.
The Trade Setup
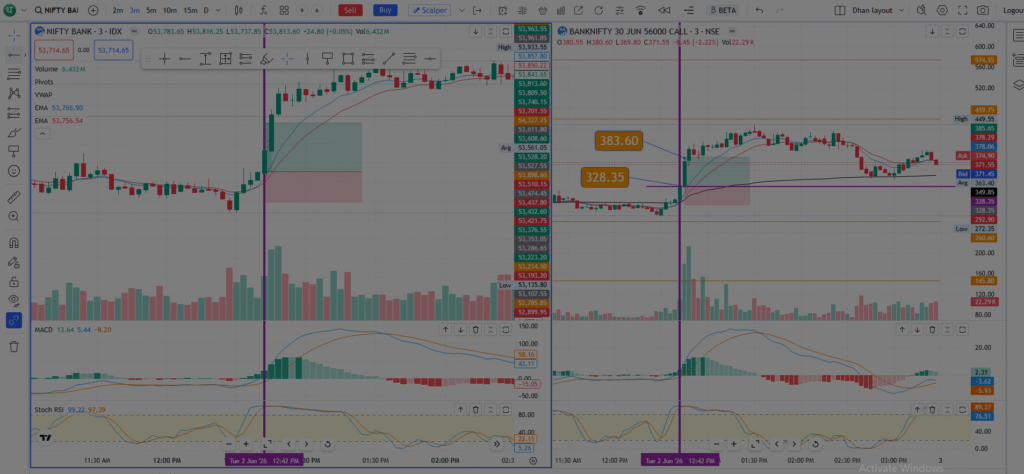
On the day of the trade, I was monitoring both:
- Bank Nifty Spot Chart
- Bank Nifty 56000 Call Option Chart
Instead of looking only at the option premium, I focused on what the actual Bank Nifty index was doing.
This is a mistake many beginners make.
They watch the option chart but ignore the underlying index.
What I Observed Before Entering
1. Strong EMA Crossover
The faster EMA crossed above the slower EMA.
This indicated that buyers were gaining control and momentum was shifting upward.
The price was trading comfortably above both EMAs.
This was my first bullish signal.
2. Price Above VWAP
The Bank Nifty price was trading above VWAP.
For intraday traders, VWAP often acts as a key support and trend confirmation level.
As long as price remains above VWAP, buyers generally remain in control.
This was my second confirmation.
3. Breakout with High Volume
A large bullish candle appeared with a significant increase in volume.
Volume is important because it tells us whether market participants are supporting the move.
A breakout without volume can fail quickly.
A breakout with strong volume has a better probability of continuation.
This was my third confirmation.
4. Bullish MACD
MACD showed a bullish crossover.
The histogram turned positive and momentum started increasing.
This confirmed that buying pressure was building.
This became my fourth confirmation.
5. RSI Warning
One thing I noticed was that the Stochastic RSI was already near overbought territory.
Many traders become afraid when they see RSI above 80.
However, in strong trends, RSI can remain overbought for extended periods.
Instead of treating it as a sell signal, I treated it as a warning to manage risk carefully.
My Actual Trade
Entry
Bank Nifty 56000 CE
Premium Buy Price: ₹328.35
Lot Size: 30
Investment:
₹328.35 × 30
= ₹9,850.50
Target
Target Premium:
₹383.60
Expected Profit:
(₹383.60 − ₹328.35) × 30
= ₹1,657.50
Potential Return:
Around 16.8% on capital deployed.
What Happened Next?
The option premium moved exactly in the anticipated direction.
The premium touched around ₹385+ during the session.
My target zone was reached.
What impressed me most was not the profit.
What impressed me was the process.
Every major indicator was telling the same story:
✅ EMA Bullish
✅ VWAP Bullish
✅ Volume Breakout
✅ MACD Bullish
✅ Spot Chart Confirmation
When multiple factors align together, the probability of success improves significantly.
Biggest Lesson I Learned
This trade taught me an important lesson.
Successful trading is not about predicting the future.
It is about identifying situations where probabilities are in your favor.
Instead of guessing:
- I waited for confirmation.
- I followed price action.
- I checked volume.
- I checked momentum.
- I checked trend direction.
Only then did I consider taking the trade.
Why I Started Testing with Just 1 Lot
Many traders make the mistake of increasing position size too early.
I chose a different approach.
I started testing with only 1 lot because:
- Risk remains controlled.
- Emotions stay manageable.
- Strategy performance becomes easier to evaluate.
- Mistakes become less expensive.
My focus right now is consistency, not quantity.
If a strategy works repeatedly with 1 lot, scaling can come later.
Is This Strategy Perfect?
Absolutely not.
No trading strategy wins 100% of the time.
There will be losing trades.
There will be false breakouts.
There will be unexpected market events.
However, based on my observations, this combination of:
- EMA Trend Confirmation
- VWAP Support
- Volume Breakout
- MACD Momentum
- Spot Chart Analysis
appears promising and deserves further testing.
I plan to continue tracking every trade and documenting the results.
Final Thoughts
This was only one trade.
One trade does not prove a strategy.
But it does provide evidence that a process may be working.
For now, I will continue testing patiently with small position sizes, maintaining strict discipline and focusing on learning rather than chasing quick profits.
The goal is not to become a gambler.
The goal is to become a disciplined trader.
And every successful trader starts exactly the same way:
One trade.
One lesson.
One step at a time.
Disclaimer: I am not a SEBI-registered investment advisor. This article is for educational and research purposes only and should not be considered financial, investment, or trading advice. Please do your own research before making any investment or trading decisions. I am not responsible for any financial losses arising from the use of this information.

Er. Adesh Saxena is a Computer Science engineer, corporate trainer, and speaker with 14+ years of experience in digital marketing, IT, BFSI, data, and cybersecurity. In 2020, he faced a financial loss of over ₹1 crore, which changed his life. Determined to rebuild, he learned wealth-building strategies from top finance experts. Now, through FinanceGrowKar.com, he shares practical money lessons to help others grow financially.